Kondo Metal and Ferrimagnetic Insulator on the Triangular Kagome Lattice
Date:20-07-2012 Print
Recently, Wu-Ming Liu's group from Institute of Physics Chinese Academy of Sciences obtained the rich phase diagrams in the Hubbard model on the triangular kagome lattice as a function of interaction, temperature and asymmetry, by combining the cellular dynamical mean-field theory with the continuous time quantum Monte Carlo method.
Geometrically frustrated systems have shown a lot of interesting phenomena, such as the spin liquid and spin ice. The charge and magnetic order driven by interaction is still one of the central issues in the field of strongly correlation systems. Recently, a new class of two-dimensional materials Cu9X2(cpa)6•xH2O (cpa=2-carboxypentonic acid, a derivative of ascorbic acid; X=F, Cl,Br) has been found, which is formed by an extra set of triangles insides of the kagome triangles. The Cu spins form a new type of geometrically frustrated lattice called triangular kagome lattice. The ``triangles-in-triangles'' structure on the triangular kagome lattice induces two different sublattice. Therefore, it is desirable to investigate the Mott and magnetic transition on the triangular kagome lattice under the influence of asymmetry which is induced by different hoppings between two sublattices.
In this work, Professor Wu-Ming Liu, Dr. Yao-Hua Chen, Dr. Hong-Shuai Tao, and Professor Dao-Xin Yao from Sun Yat-sen University employ the cellular dynamical mean-field theory combined with continuous time quantum Monte Carlo method to investigate the influence of asymmetry on the Mott and magnetic phase transition on the triangular kagome lattice. Two novel phases called plaquette insulator and Kondo metal induced by asymmetry is found in the phase diagram and their properties are studied by determining the momentum resolved spectrums. By defining a magnetic order parameter, they can characterize a ferrimagnetic order for the large interaction on the triangular kagome lattice. The phase diagram with the competition between interaction and asymmetry is provided. In addition, the spectral functions on the Fermi surface for the different interaction and asymmetry are presented.
In summary, this work provides a helpful step for understanding the coexisting behavior in metal-insulator transition, the formation of magnetic order in frustrated systems with asymmetry. All kind of spectrum is presented, which can be used to detect these phases in real materials, such as Cu9X2(cpa)6•xH2O, under applied pressure in experiments. This work was supported by Chinese Academy of Sciences, the National Natural Science Foundation of China, and the ministry of science and technology of China. It has been published in Physical Review Letters 108, 246402 (2012).
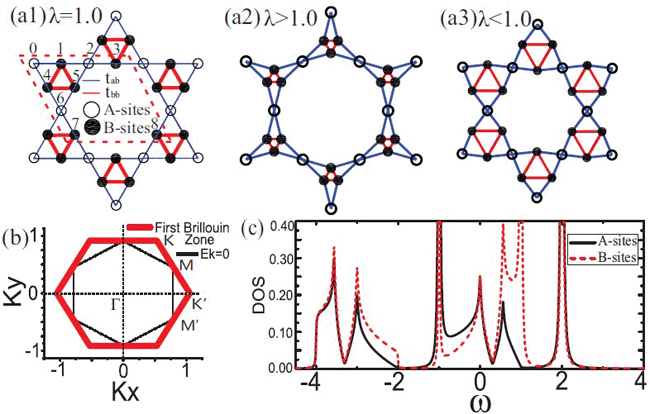 |
| FIG. 1 (a1) The unit cell of the symmetric triangular kagome lattice (λ=1, whereλ is the asymmetry factor). (a2) Whenλ>1, the triangular kagome lattice is similar with the kagome lattice. (a3) Whenλ<1, the triangular kagome lattice is transformed into a system composed of many triangular plaquettes. (b) The thick red lines show the first Brillouin zone of the triangular kagome lattice. The thin black lines correspond to the Fermi surface for non-interacting case. (c) The density of states of the symmetric triangular kagome lattice for the A- and B-sites when U=0. (Image by Wu-Ming Liu et al.) |
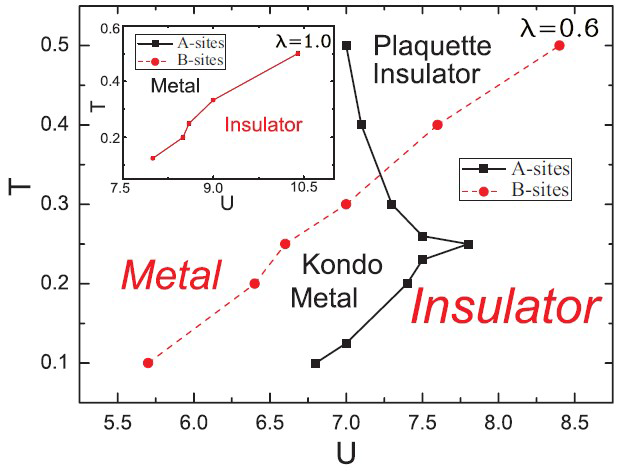 |
| FIG. 2 Phase diagram of the triangular kagome lattice atλ=0.6. Inset: The phase diagram of the symmetric triangular kagome lattice (λ=1). (Image by Wu-Ming Liu et al.) |
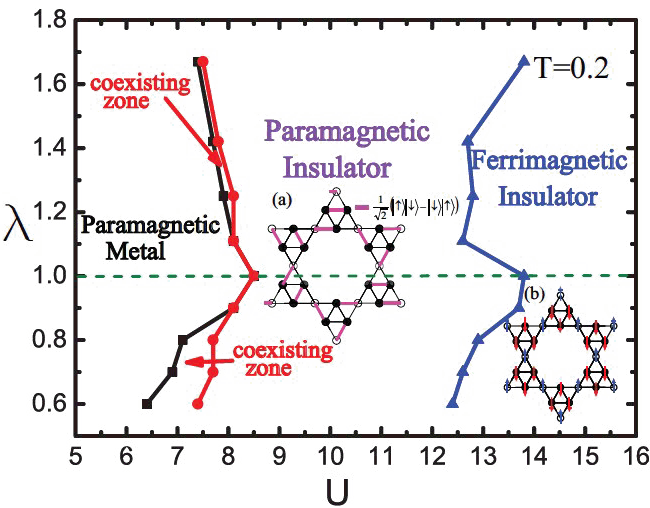 |
| FIG. 3 The phase diagram of the triangular kagome lattice represents the competition between U andλ for T=0.2. The region between the black lines and the red lines denotes the coexisting zone which contains the plaquette insulator and the Kondo metal parts. A wide paramagnetic insulating region is found with an intermediate U. The blue lines show the transition point to the ferrimagnetic insulator with a clear magnetic order. Inset: (a) One kind of possible dimers formed in the paramagnetic insulator, (b) Spin configuration of ferrimagnetic insulator. (Image by Wu-Ming Liu et al.) |
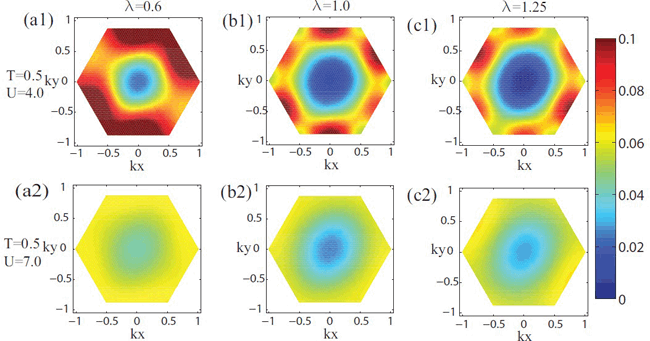 |
| FIG. 4 The evolution of the spectral function on Fermi surface. (a) λ=0.6. (b) λ=1. (c) λ=1.25. (Image by Wu-Ming Liu et al.) |